Benchmarks
For developers and operators comparing SQL dialects or shard counts on their own hardware. These are single-host laptop-scale numbers — good for relative comparison, not for capacity planning. For absolute numbers and how to size a deployment, see Cloud Benchmarks.
The benchmarks in fixtures in the Dwarf repository measure end-to-end flow throughput and latency through the public API
(Run = create + await) against whatever SQL dialect SEQUEL_TESTING_DSN points at. They measure what code
review cannot tell you: how many flows and steps per second each dialect sustains at each shard count, and the
dispatch-latency percentiles.
These numbers are reference points for relative comparison, not a capacity guarantee. They were taken on a single developer laptop with every database in a local Docker container on the same host — a co-located setup that is a dev/test shape, not production. Read the ratios and trends (which dialect is faster, how latency changes with load, what sharding does), not the absolute numbers, which reflect one laptop.
Running
Pick one dialect per invocation (the dialect is the DSN, not a Go flag). -run=X selects no unit tests so
only benchmarks run; -benchtime=1000x fixes the flow count so each shard count does one measured pass.
# SQLite in-memory (no env)
go test ./fixtures/ -run=X -bench=BenchmarkFlowThroughput -benchtime=1000x

# PostgreSQL
SEQUEL_TESTING_DSN='postgres://USER:[email protected]:5432/dwarfbench_%d?sslmode=disable' \
  go test ./fixtures/ -run=X -bench=BenchmarkFlowThroughput -benchtime=1000x

# MySQL / MariaDB
SEQUEL_TESTING_DSN='USER:PASS@tcp(127.0.0.1:3306)/dwarfbench_%d' \
  go test ./fixtures/ -run=X -bench=BenchmarkFlowThroughput -benchtime=1000x

# SQL Server  (enable READ_COMMITTED_SNAPSHOT on the model database first to avoid deadlocks;
#              add &encrypt=disable against a container using a self-signed certificate)
SEQUEL_TESTING_DSN='sqlserver://sa:[email protected]:1433?database=dwarfbench_%d&encrypt=disable' \
  go test ./fixtures/ -run=X -bench=BenchmarkFlowThroughput -benchtime=1000x
SQL Server TLS. The stock SQL Server container ships a self-signed certificate whose serial number is negative, which Go’s
crypto/x509refuses to parse — every connection then dies withTLS Handshake failed: x509: negative serial number, long before any query runs.&encrypt=disable(or a real certificate) is required against such a server. This is a driver/TLS constraint, not a Dwarf one.
Swap -bench=BenchmarkFlowThroughput for -bench=BenchmarkStatePayload (use a smaller -benchtime, e.g.
100x, since large payloads are slow) to measure byte throughput across payload sizes — see the section below.
The %d is required — the harness creates an isolated, auto-dropped database per shard (and drops it on
shutdown), so no manual provisioning is needed; the connecting user only needs CREATE DATABASE rights.
The custom metrics are what to look at: flows/s, steps/s, and p50_ms / p95_ms / p99_ms end-to-end
latency. Go’s built-in ns/op is elapsed time per flow averaged across the concurrent submitters, which is
less useful here.
Workload and Configuration
| Knob | Value | Why |
|---|---|---|
| Graph | linear T0 → T1 → T2 → END | 3 trivial (no-op) tasks, so 3 steps/flow and each step is essentially its own DB transaction |
| Client concurrency | 32 goroutines | offered load; matched to the worker pool so the pool stays saturated |
| Worker pool | 32 | fixed across dialects/shard counts |
| Per-shard connection pool | 30, pinned by the benchmark harness | the test default (4) starves 32 workers and would measure the pool, not the engine; 30 keeps 3 co-located shards under PostgreSQL’s default max_connections=100 (≈90) |
| Flows per pass | 1000 (-benchtime=1000x) | one measured pass per shard count; repeat the whole invocation ≥3× and take medians, since a single pass is not reproducible (see the results note) |
Because the tasks are no-ops, essentially all of each step’s time is its durable DB transaction (claim CAS
- transition commit). So these numbers isolate the engine’s own per-step cost — the database work and commit latency, with almost nothing else. A real workload does actual work in each task, so its task bodies, not this overhead, would dominate the time; these numbers are the engine’s floor.
Results
Hardware: Apple M1 Pro (arm64, macOS); PostgreSQL 18, MariaDB 10.11, and SQL Server 2019 each in a local Docker container on the same host.
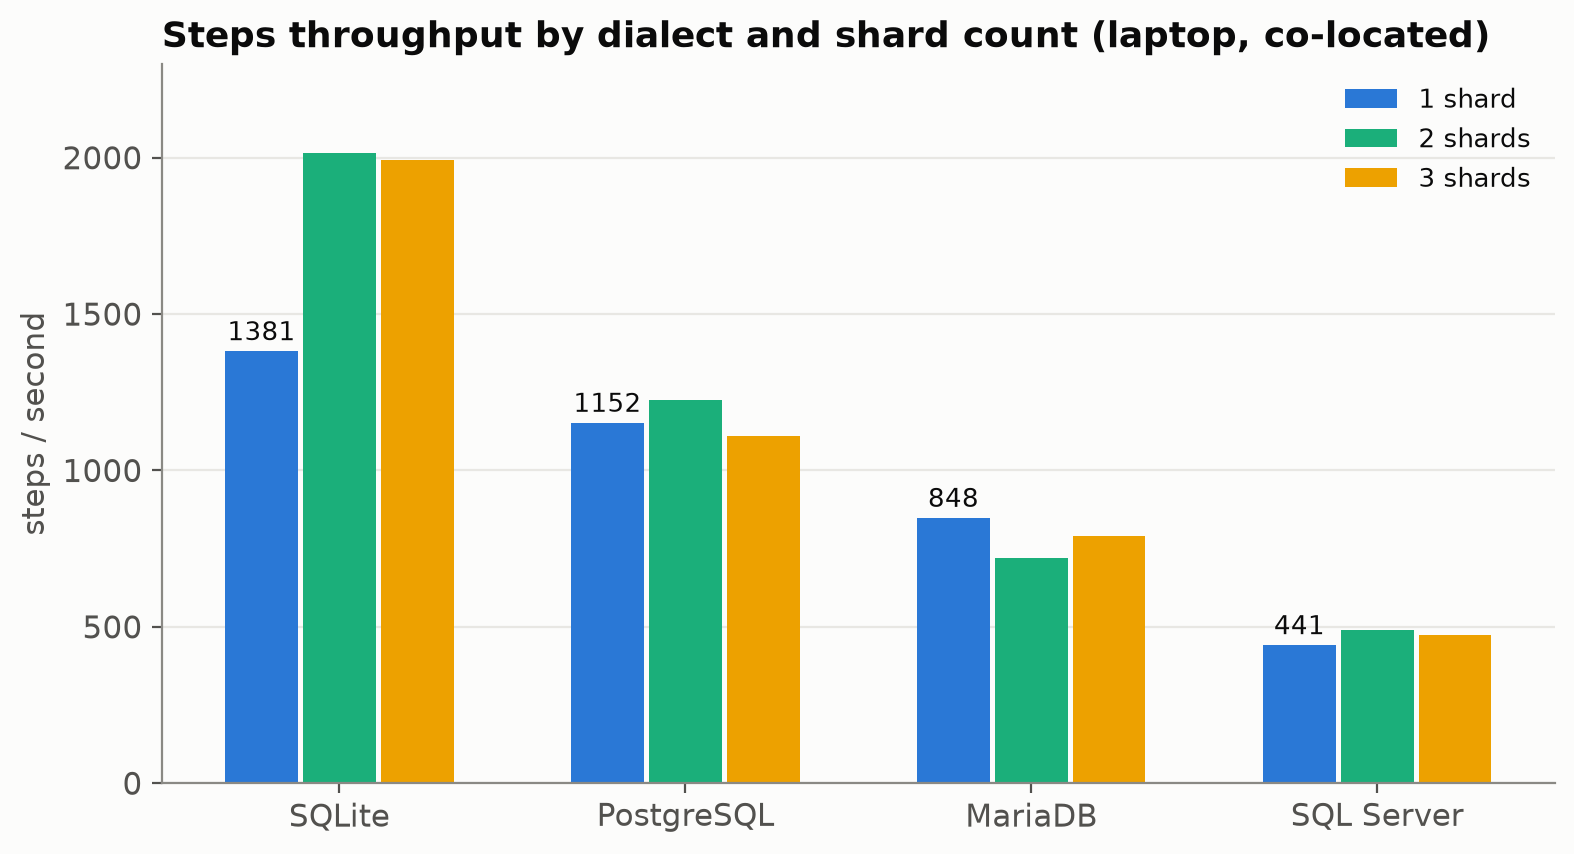
Each cell is the median of three runs. Run-to-run variance on a shared laptop is larger than it looks: SQLite was reproducible to within 4%, but PostgreSQL spanned up to 2.1× and SQL Server 1.7× between rounds on the same configuration. A single run of any server dialect here can land far from its median, so treat differences under ~25% as noise and never quote a single pass.
SQLite (In-Memory)
| Shards | flows/s | steps/s | p50 ms | p95 ms | p99 ms |
|---|---|---|---|---|---|
| 1 | 460 | 1381 | 65.8 | 100.8 | 117.0 |
| 2 | 672 | 2016 | 42.5 | 93.1 | 116.9 |
| 3 | 664 | 1992 | 35.6 | 100.8 | 129.6 |
PostgreSQL
| Shards | flows/s | steps/s | p50 ms | p95 ms | p99 ms |
|---|---|---|---|---|---|
| 1 | 384 | 1152 | 73.6 | 174.2 | 256.4 |
| 2 | 409 | 1226 | 73.5 | 109.8 | 154.4 |
| 3 | 370 | 1109 | 77.4 | 110.3 | 238.4 |
MySQL / MariaDB
| Shards | flows/s | steps/s | p50 ms | p95 ms | p99 ms |
|---|---|---|---|---|---|
| 1 | 282 | 848 | 109.4 | 149.2 | 176.1 |
| 2 | 240 | 719 | 118.6 | 177.1 | 253.6 |
| 3 | 263 | 789 | 114.4 | 176.6 | 230.4 |
SQL Server
| Shards | flows/s | steps/s | p50 ms | p95 ms | p99 ms |
|---|---|---|---|---|---|
| 1 | 147 | 441 | 185.4 | 432.3 | 641.5 |
| 2 | 163 | 489 | 181.5 | 295.3 | 422.0 |
| 3 | 158 | 473 | 186.7 | 301.9 | 449.9 |
How to Read These
Dialect ranking (1 shard): PostgreSQL is the fastest real server (≈1152 steps/s), then MariaDB (≈848), then SQL Server (≈441) — consistent with the deployment guidance that recommends PostgreSQL for production. SQLite in-memory is fastest of all, for one replica: it cannot be shared between hosts.
Sharding on a single host neither helps nor hurts much for server databases. Across three rounds every server dialect stayed within ~15% of its own 1-shard median at 2 and 3 shards, with no consistent direction: PostgreSQL and SQL Server happened to peak at 2 shards, MariaDB at 1. Those gaps sit inside the run-to-run spread above, so the honest reading is no measurable effect, not a cost and not a gain. That is the expected result — when shards are separate databases on the same server they add connection and coordination overhead without adding hardware, and sharding is a way to scale across servers (one shard per database server — see Deployment). A single-host benchmark can only show its overhead, never its benefit, so treat the shard rows as a reliability check — proof that a multi-database engine still routes and completes every flow correctly — rather than as a scaling demo.
SQLite is the exception, and for an instructive reason. It gets faster with more shards (460 → 672 flows/s) because each shard is a separate in-memory database with its own single-writer lock, so sharding parallelizes the one-writer-at-a-time bottleneck that is SQLite’s defining constraint. The gain lands by 2 shards and does not continue at 3. It is specific to independent in-memory databases and does not transfer to a shared server.
Latency comes mainly from durable commits. A ~74 ms p50 for a 3-step flow on PostgreSQL works out to ~25 ms per step, and each step is a synchronously-committed transaction (claim + transition) running under 32-way concurrency on laptop Docker. A real workload adds task time on top of this, so treat these figures as the engine’s baseline latency, not the total you would see in production.
State Payload Throughput (bytes/sec)
BenchmarkStatePayload seeds each flow’s initial state with a JSON string of a given size and carries it
unchanged through the three no-op steps, so every step reads it and hands it on. The headline metric is
payloadMB/s = payload size × steps/sec: the rate at which caller state passes through steps. Fixed at 1 shard. (Same hardware/config as above; median of three runs at
-benchtime=100x.)
Persisted bytes are not a fixed multiple of this number. The engine avoids re-storing a payload a step did not change, referring to the copy the predecessor already stored instead. How many bytes actually land on disk therefore depends on the flow’s shape: a chain that rewrites the payload at every step stores roughly one copy per step, while a chain that merely carries a payload it never touches (what this benchmark measures) stores far less than one. Size storage from your own workload’s shape, not from a constant.
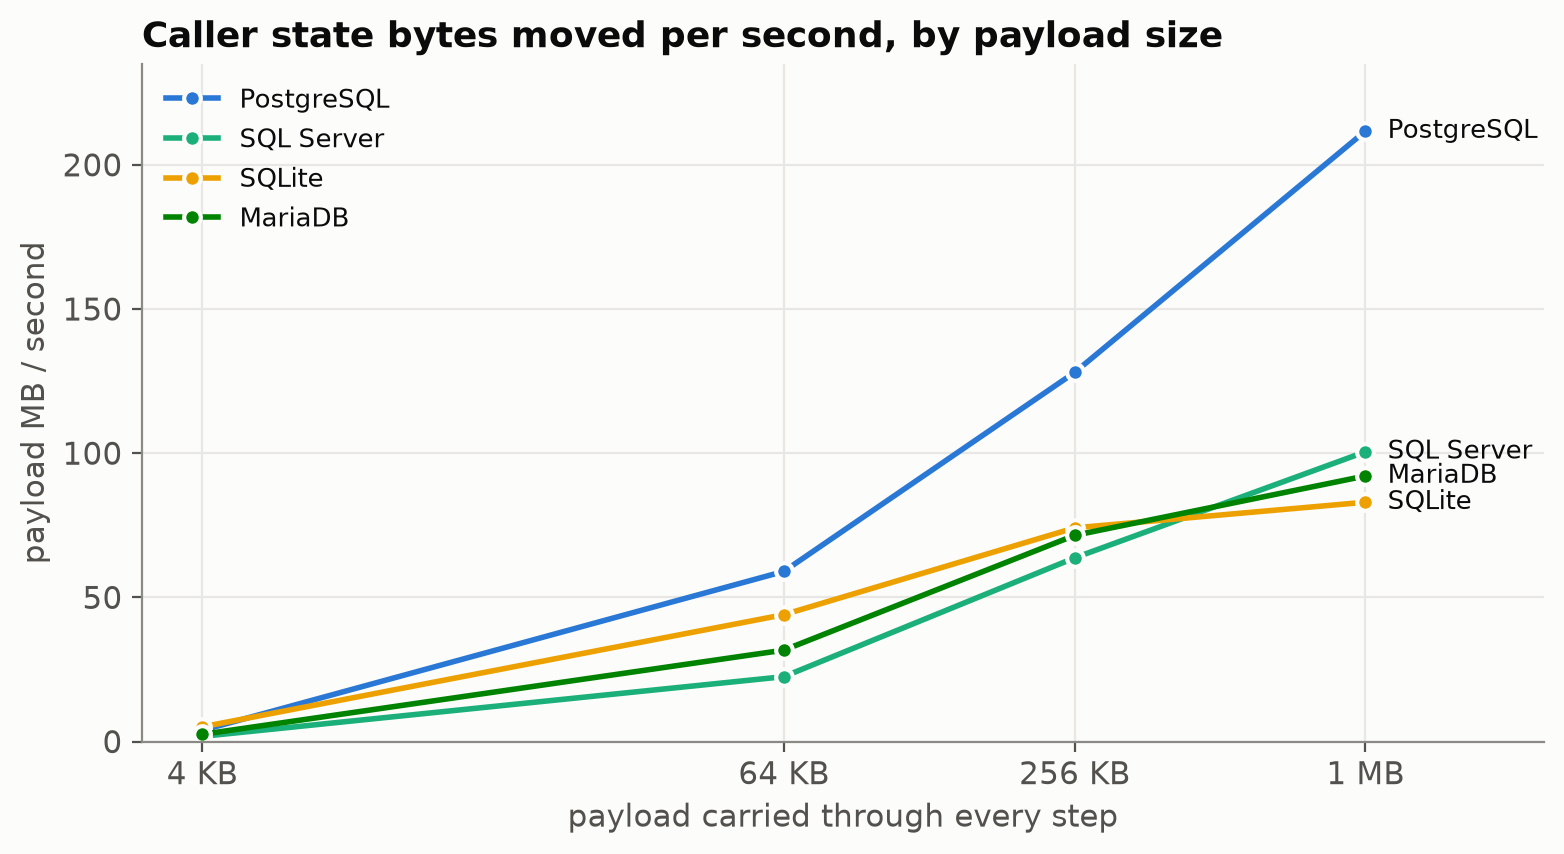
payloadMB/s by payload size:
| Payload | SQLite | PostgreSQL | MariaDB | SQL Server |
|---|---|---|---|---|
| 4 KB | 5.1 | 3.9 | 2.5 | 1.8 |
| 64 KB | 44.0 | 59.0 | 31.7 | 22.5 |
| 256 KB | 74.1 | 128.0 | 71.5 | 63.7 |
| 1 MB | 83.0 | 211.7 | 92.1 | 100.5 |
What a 1 MB payload costs — throughput drops sharply and latency rises:
| SQLite | PostgreSQL | MariaDB | SQL Server | |
|---|---|---|---|---|
| flows/s | 27.7 | 70.5 | 30.7 | 33.5 |
| p50 latency | 0.93 s | 0.37 s | 0.85 s | 0.84 s |
Reading it:
- The byte rate rises steeply with payload size. With a tiny payload, each step’s fixed overhead dominates, so few caller bytes move per second; a larger payload spreads that fixed cost over more bytes, so the rate climbs — by roughly 20–50× from 4 KB to 1 MB on every dialect. SQLite is the only one clearly flattening by 1 MB (74 → 83 MB/s), which is its single writer reaching its limit; PostgreSQL was still climbing at the largest size measured, so its ceiling lies above this range. On a 32 vCPU cloud database, with every step writing a fresh 64 KB JSON document, PostgreSQL moved ~176 MB/s of payload (see Cloud Benchmarks).
- The dialect ranking flips compared with small state. SQLite led on tiny-state flow rate, but at 1 MB PostgreSQL is well ahead (~212 MB/s), then SQL Server (~101), MariaDB (~92), and SQLite (~83). For large payloads what matters is how well the database parallelizes big writes: PostgreSQL and MySQL spread them across many connections, whereas SQLite has a single writer that handles them one at a time, so its byte rate levels off early. So the best dialect depends on how large your state is, not just on the raw flow rate.
- SQL Server holds up at large payloads (~101 MB/s, a 1 MB flow at ~0.8 s median) because its JSON payload columns are stored as binary rather than UTF-16 text: half the bytes written and read for the same caller payload, and no large-object path.
- Large state is still expensive. A flow carrying 1 MB of state takes hundreds of milliseconds, not
milliseconds, and small payloads move caller bytes 20–50× less efficiently than large ones. Workflows that
move large documents should trim state early with
flow.Del, and keep big blobs in object storage — passing only a key through flow state. (A flow’s final state can be up to 256 MB on all four dialects — there is no 64 KB cap.)
SQLite on a File
The tables above run SQLite in memory, where nothing reaches the disk. A durable single-replica deployment runs it
on a file (Deployment), and the journal and sync settings in the
file’s DSN decide what each commit costs. The test harness always opens SQLite in memory, so these runs use the load
harness in bench/, one arm per DSN:
go run ./bench -dsn 'file:/tmp/dwarf_1.db?_pragma=journal_mode(WAL)&_pragma=synchronous(NORMAL)' \
-workload linear -concurrency 8,32 -window 60s -warmup 15s| Knob | Value |
|---|---|
| Graph | linear, 10 no-op tasks, so 10 steps per flow, empty state |
| Client concurrency | 8 and 32 closed-loop submitters |
| Workers, connections | derived by the engine (8 connections per SQLite shard) |
| Window | 60 s after a 15 s warmup, a fresh file for every run |
| Hardware | Apple M1 Pro, macOS 15, the internal SSD (APFS) |
Each cell is the median of three runs, interleaved across the arms. Throughput in steps/s:
| DSN settings | 8 submitters | 32 submitters | p50 / p99 ms at 32 |
|---|---|---|---|
| In memory (reference) | 3,133 | 2,961 | 100 / 267 |
| File, default rollback journal | 689 | 632 | 459 / 1,407 |
File, journal_mode(WAL) (synchronous FULL, the default) | 2,100 | 1,970 | 142 / 486 |
File, journal_mode(WAL)&synchronous(NORMAL) | 2,596 | 2,326 | 118 / 456 |
| Two files as two shards, WAL and NORMAL | 3,668 | 3,834 | 75 / 324 |
File, WAL, FULL and fullfsync(1) | 60 | 60 | 5,074 / 8,507 |
These runs use a different harness and workload from the tables above, so compare the rows with each other, not with those tables. Reading it:
- Write-ahead logging is the setting that matters most. The rollback journal blocks readers while a transaction
writes: a third of WAL’s throughput, multi-second tails, and claims that timed out with
SQLITE_BUSY(retried, so no step was lost). synchronous(NORMAL)added 18-24% over the defaultFULL, here. It trades durability for that: under NORMAL, a power loss can roll back the last commits.- macOS understates what
FULLcosts. A sync on macOS does not flush the drive’s cache unlessfullfsyncis on, and with it on a commit waits for the flush: 60 steps/s. On Linux a sync does flush, soFULLcosts more there than in this table. Measure on the hardware you deploy. - A second file nearly doubles the ceiling (1.65x at 32 submitters), since each file has its own writer.
- A step took about 420 bytes of file with an empty state, in every file arm: the live and archive tables together, before any retention drops a day.
What This Does Not Measure
A single-host laptop run cannot show what production hardware does — those dimensions are measured by the Cloud Benchmarks: true horizontal scale on shard-per-server hardware, connection-pool budget and deployment sizing, the effect of real network latency, byte-throughput ceilings, and throughput at high volume (100M+ accumulated rows). Still open anywhere: a sustained multi-hour soak for drift (goroutine/memory/connection growth). This benchmark remains the per-dialect throughput/latency baseline the cloud numbers build on — the cloud benchmarks run PostgreSQL only, on the ranking measured here.
Next: Reference.